Projects & Impact
easyDeploy | Automated EAR Deployment Utility for WebSphere
When I first joined the project, the development team frequently requested EAR deployments across development and test environments at different times of the day. The infrastructure team (myself included) wasn’t always available to handle these requests promptly, leading to delays, bottlenecks, and inconsistent deployments. A simple, self-service deployment mechanism was needed to empower developers while maintaining control and consistency.
I created easyDeploy, a Bash-based automation utility that streamlines and standardizes the deployment of EAR files to WebSphere Application Server environments. It automates the entire process — from validating the input EAR file to generating and executing the Jython deployment script, transferring files, clearing cache, and restarting the application — all through a single command.
Key features include:
- Automated input validation and environment detection
- Dynamic deployment script generation for WebSphere targets
- Secure file transfer and remote execution using SSH/SCP
- Automated post-deployment cache cleanup and server restart
Why not Ansible, you say?
At the time, the project lacked an automation framework or control node capable of securely orchestrating deployments across environments. Ansible adoption would have required additional infrastructure, credentials management, and procedural approvals that weren’t feasible early on. easyDeploy was therefore intentionally built as a lightweight, portable solution — requiring nothing more than Bash, SSH, and standard WebSphere tools — to deliver immediate value while laying the foundation for future Ansible-based automation.
easyDeploy eliminated the dependency on manual intervention for routine deployments, allowing the development team to deploy to test environments independently while ensuring operational consistency and traceability.
This reduced deployment turnaround time, minimized coordination overhead, and improved overall productivity across development and infrastructure teams.
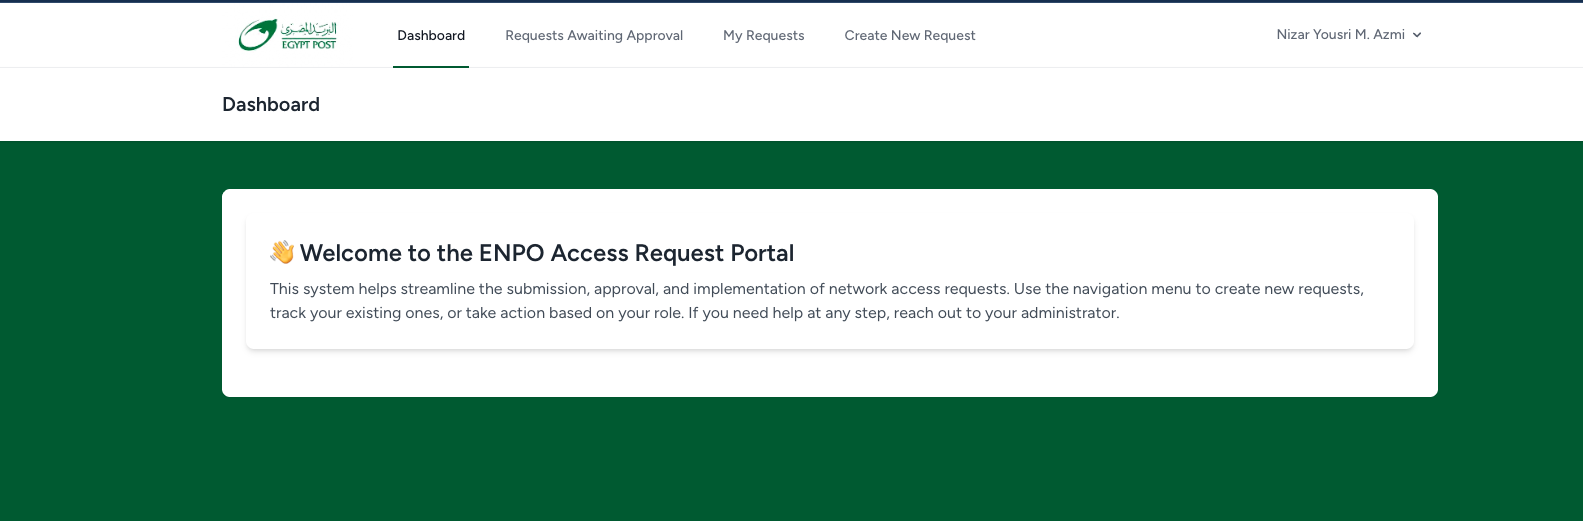
ENPOAccessRequest | Automated Network Access Approval System
The process of requesting and approving network access (such as opening ports or granting database connections) was manual, inconsistent, and time-consuming. Requests were typically shared through emails or word documents, which led to delays, missing approvals, and lack of accountability or visibility. There was a need for a centralized, auditable system to streamline request submission, approval, and implementation.
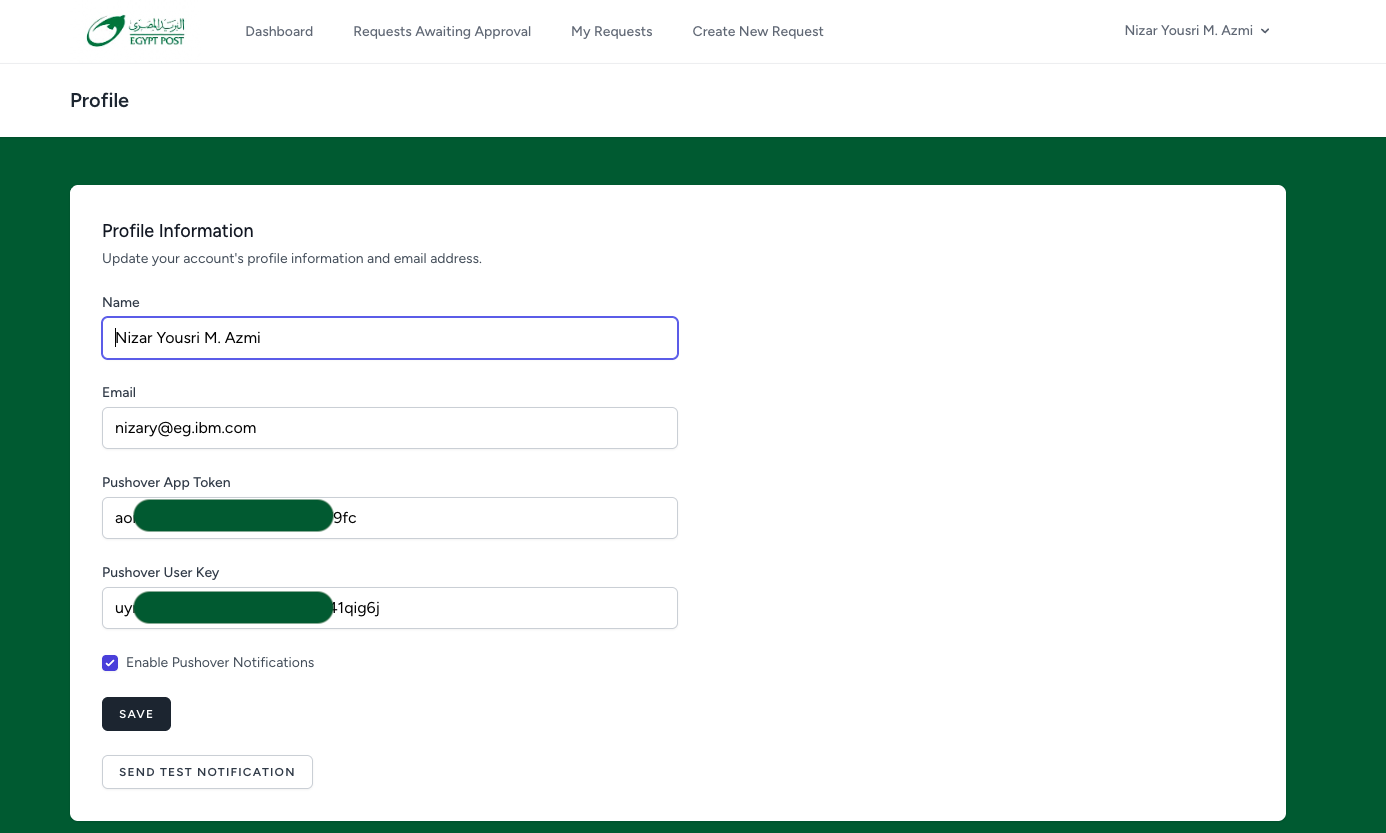
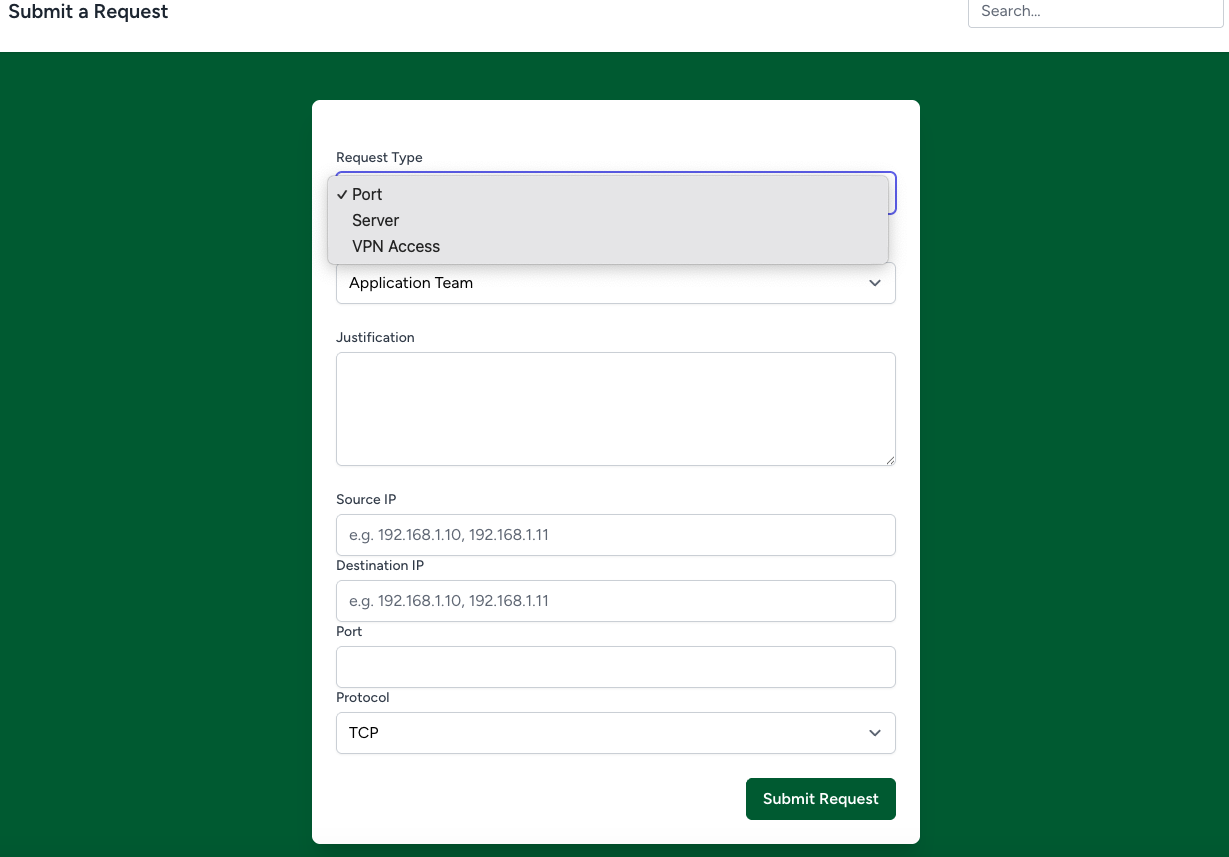
I designed and developed ENPOAccessRequest, a Laravel-based web application that automates the complete lifecycle of network access requests. The system includes:
- Role-based access control (users, approvers, and implementers) using Spatie Permissions
- Dynamic request forms for various types (e.g., port requests, VPN access)
- Automated email and Pushover notifications (real-time notifications) for each stage of approval
- An intuitive frontend built with Tailwind CSS and Vite
- Search and filter capabilities for tracking request history and status
This solution significantly reduced approval turnaround time and eliminated the confusion caused by scattered communication channels. It provided full traceability of all actions, improved collaboration between teams, and enhanced overall network security governance.
Oracle Drift Detection, Compliance Reporting , and Configurations Backups
In a mixed Oracle environments spanning 12c, 19c, Exadata, and Exadata Cloud@Customer environments, configuration drift was largely invisible until it triggered service issues or compliance audit findings. There was no centralized mechanism to detect deviations in database or host configurations.
I designed and implemented a fully automated drift detection and reporting system using Bash and Ansible.
The solution runs daily across all database hosts, collecting critical configuration files (e.g., oratab, spfile, listener settings, ASM parameters).
It then:
- Compares each host’s current snapshot against the previous day’s version.
- Generates an HTML diff report highlighting added, removed, and modified entries.
- Detects missing or newly added systems automatically.
- Publishes the HTML reports via an email and sends summarized alerts through a lightweight push mechanism (PushOver).
If you're wondering, OEM baselines provided parameter-level comparison but lacked full OS-side visibility and daily traceability across all environments.
This script-based approach unified configuration drift, audit traceability, configuration backups, and evidence collection in one place — without depending on OEM agents or UI access.
The organization gained:
- Daily configurations backups.
- Real-time drift visibility across all Oracle environments.
- Immediate audit readiness, with daily versioned evidence of configuration stability.
- Proactive detection of unapproved changes before incidents occurred.
- It also became the foundation for future compliance dashboards integrating Oracle and OS-level drifts.
Unified Observability Stack
No single place correlated JVM metrics, Oracle DB health, HTTP traffic, and application logs. Troubleshooting required jumping across separate tools, delaying detection of real issues.
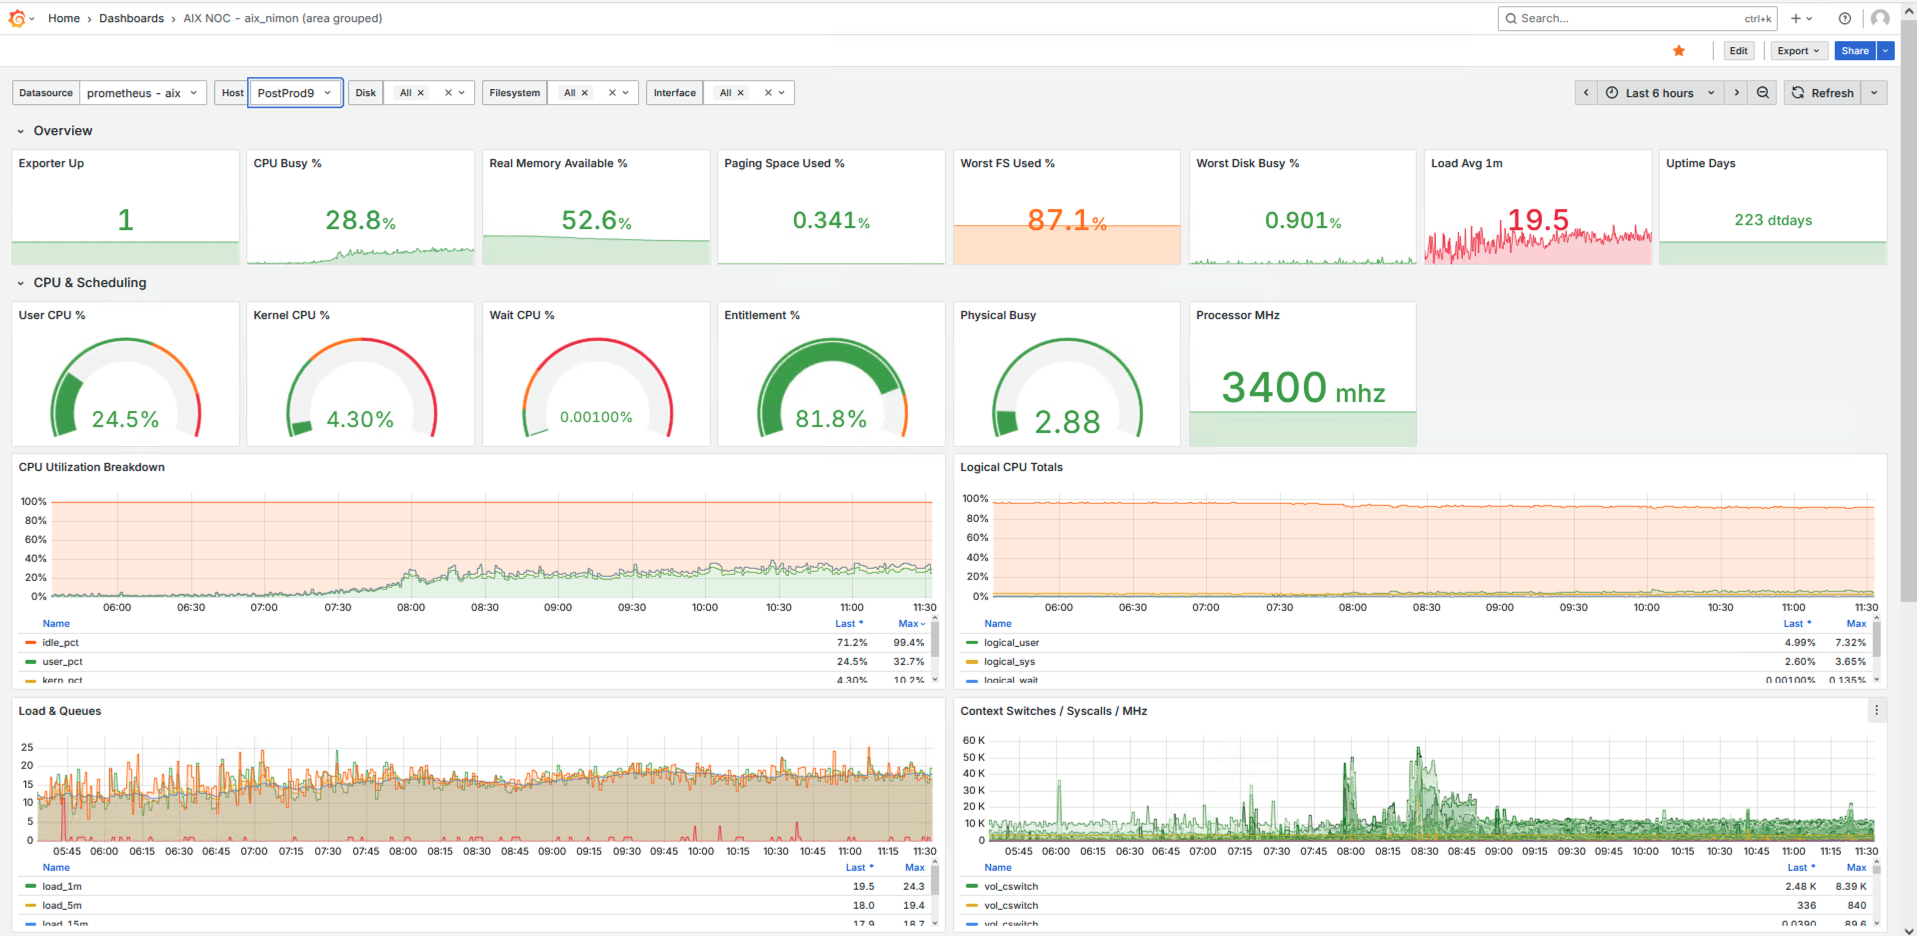
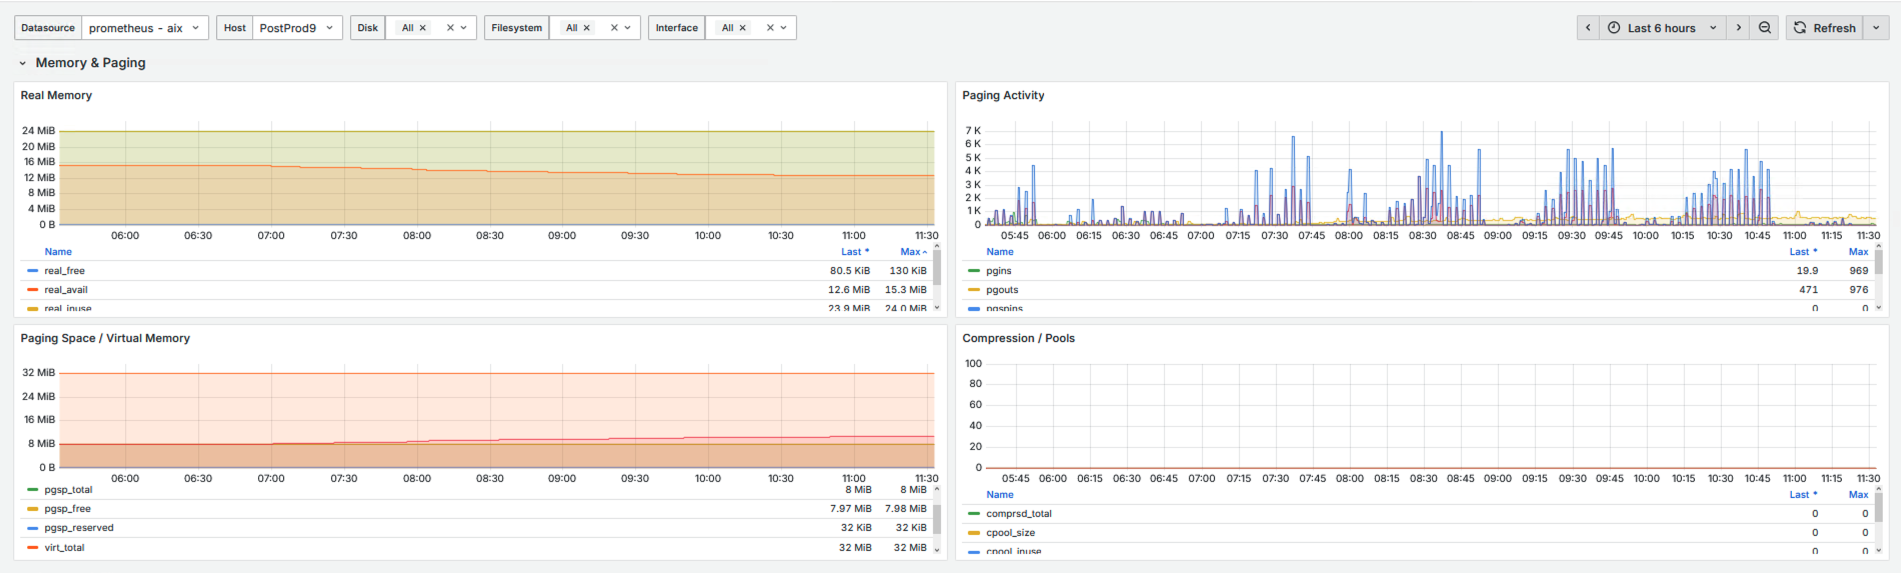
I designed and deployed a unified observability platform using Grafana, Prometheus/JMX exporters, Loki/Promtail, and GoAccess, with full integration to both middleware and database layers.
This includes:
Grafana Dashboards
- Oracle DB Dashboard using the Oracle Prometheus exporter
- Active sessions, wait events, buffer cache hit ratios, PGA/SGA usage
- Tablespace capacity forecasting
- SQL execution trends
- Linux/AIX exporters
WebSphere JVM Dashboard using JMX exporter
- Heap usage, GC cycles, GC pause time, thread pools, JDBC metrics
- Connection pool health (max used, free, wait time)
- Servlet throughput & response timing
HTTP Traffic Dashboard via GoAccess + Promtail
- Real-time traffic visualization
- User-agents, referrers, latency distribution
- Error spikes with automated correlation to logs
Application Logs Dashboard using Loki + LogQL
- Error rate per service
- Pattern detection for recurring exceptions
- Log-based alerts tied to JVM/DB conditions
End-to-End Correlation
We can now track a complete chain: Traffic spike → JVM load → JDBC latency → Oracle wait events → corresponding log errors.
We can spot problems — JDBC slowness, connection pool exhaustion, DB bottlenecks, or abnormal traffic — before any user reports it. The stack reduced troubleshooting time drastically and transformed operations from reactive firefighting to proactive monitoring.
Sample Screenshots
Downtime Announcement Automation for WebSphere / IHS
During system restarts or planned maintenance windows, users accessing applications hosted on IBM HTTP Server would see connection errors or blank pages. This created confusion and triggered unnecessary support tickets and complaints because there was no clear indication that downtime was intentional or temporary. A consistent way to broadcast maintenance status across all servers was missing.
I created a MaintenanceMode function which is a shell script utility designed to toggle a maintenance message across multiple IBM HTTP Server instances. It is intended to be used during emergency restarts or planned downtime of WebSphere Application Server environments.
This helps us avoid confusion and support calls by clearly letting users know that downtime is intentional—especially in emergency cases.
Real-Time Infrastructure Monitoring & Push-Based Alerting Architecture
Before this work, we had no unified, real-time visibility into the health of mission-critical components across the ENPO landscape — WebSphere JVMs, Oracle databases, SCAN listeners, Exadata VM Clusters, storage usage on AIX/Linux hosts, Tuxedo/ACE execution groups, and more. Most issues surfaced only when users complained, which meant long triage cycles, late reactions, and occasional outages that could have been avoided with early detection.
I wanted a monitoring approach that met three goals:
- Real-time visibility with immediate push alerts
- No exposure of internal systems to the public Internet
- Zero dependency on heavy enterprise tools (OEM, Dynatrace, Moogsoft, Netcool, etc.)
So I built a fully custom, security-first monitoring and alerting architecture using Bash + SSH + Oracle utilities + IBM MQ/ACE tools + Pushover.
I designed and implemented a lightweight, event-driven monitoring system running fully inside the on-premise ENPO environment.
1. Single Hardened “Managing Node”
Only one server had temporary outbound internet access. Nothing else in the infrastructure was ever exposed — not a single port, not a single daemon.
This managing node:
- Executed all health checks
- Queried AIX, Linux, Oracle DB, Grid Infrastructure, JVMs, and VM Clusters
- Parsed output and performed condition-based logic
- Sent notifications to Pushover using short-lived, one-time API calls
- Immediately closed the outbound route after each alert
- Logged every action for auditing
This gave us full real-time monitoring without compromising security.
2. Deep Health Checks Across the Stack
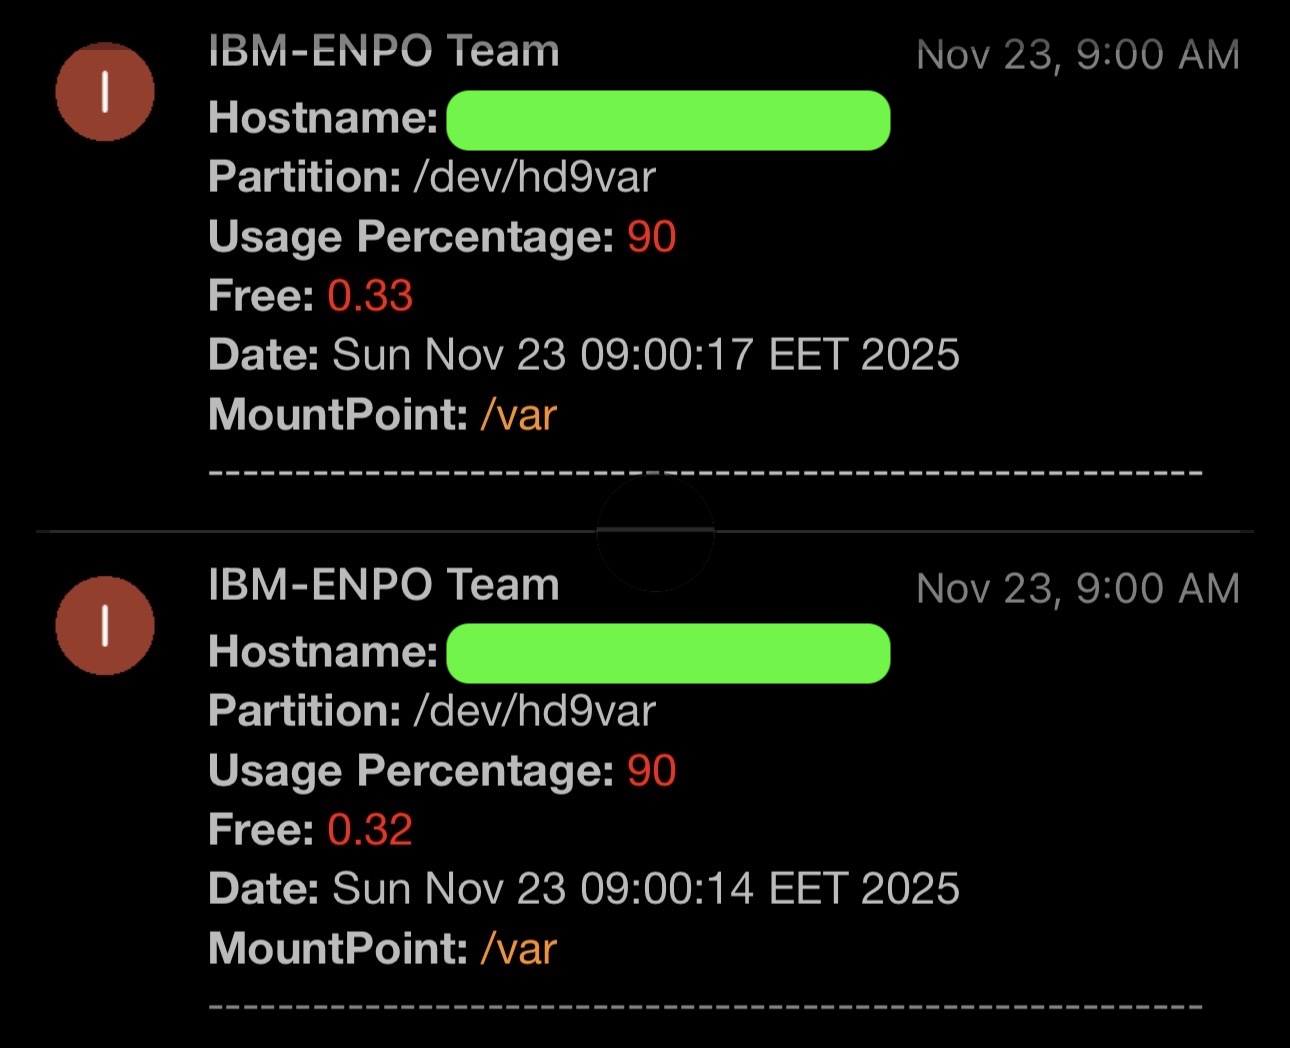
Every alert in the screenshots comes from custom monitoring scripts I wrote — no third-party monitoring software involved.
The managing node checks:
AIX / Linux OS
- Filesystem usage (e.g., /dev/hd9var hitting 90%)
- CPU load
- Memory pressure
- Stuck mount points
Oracle Databases & Grid
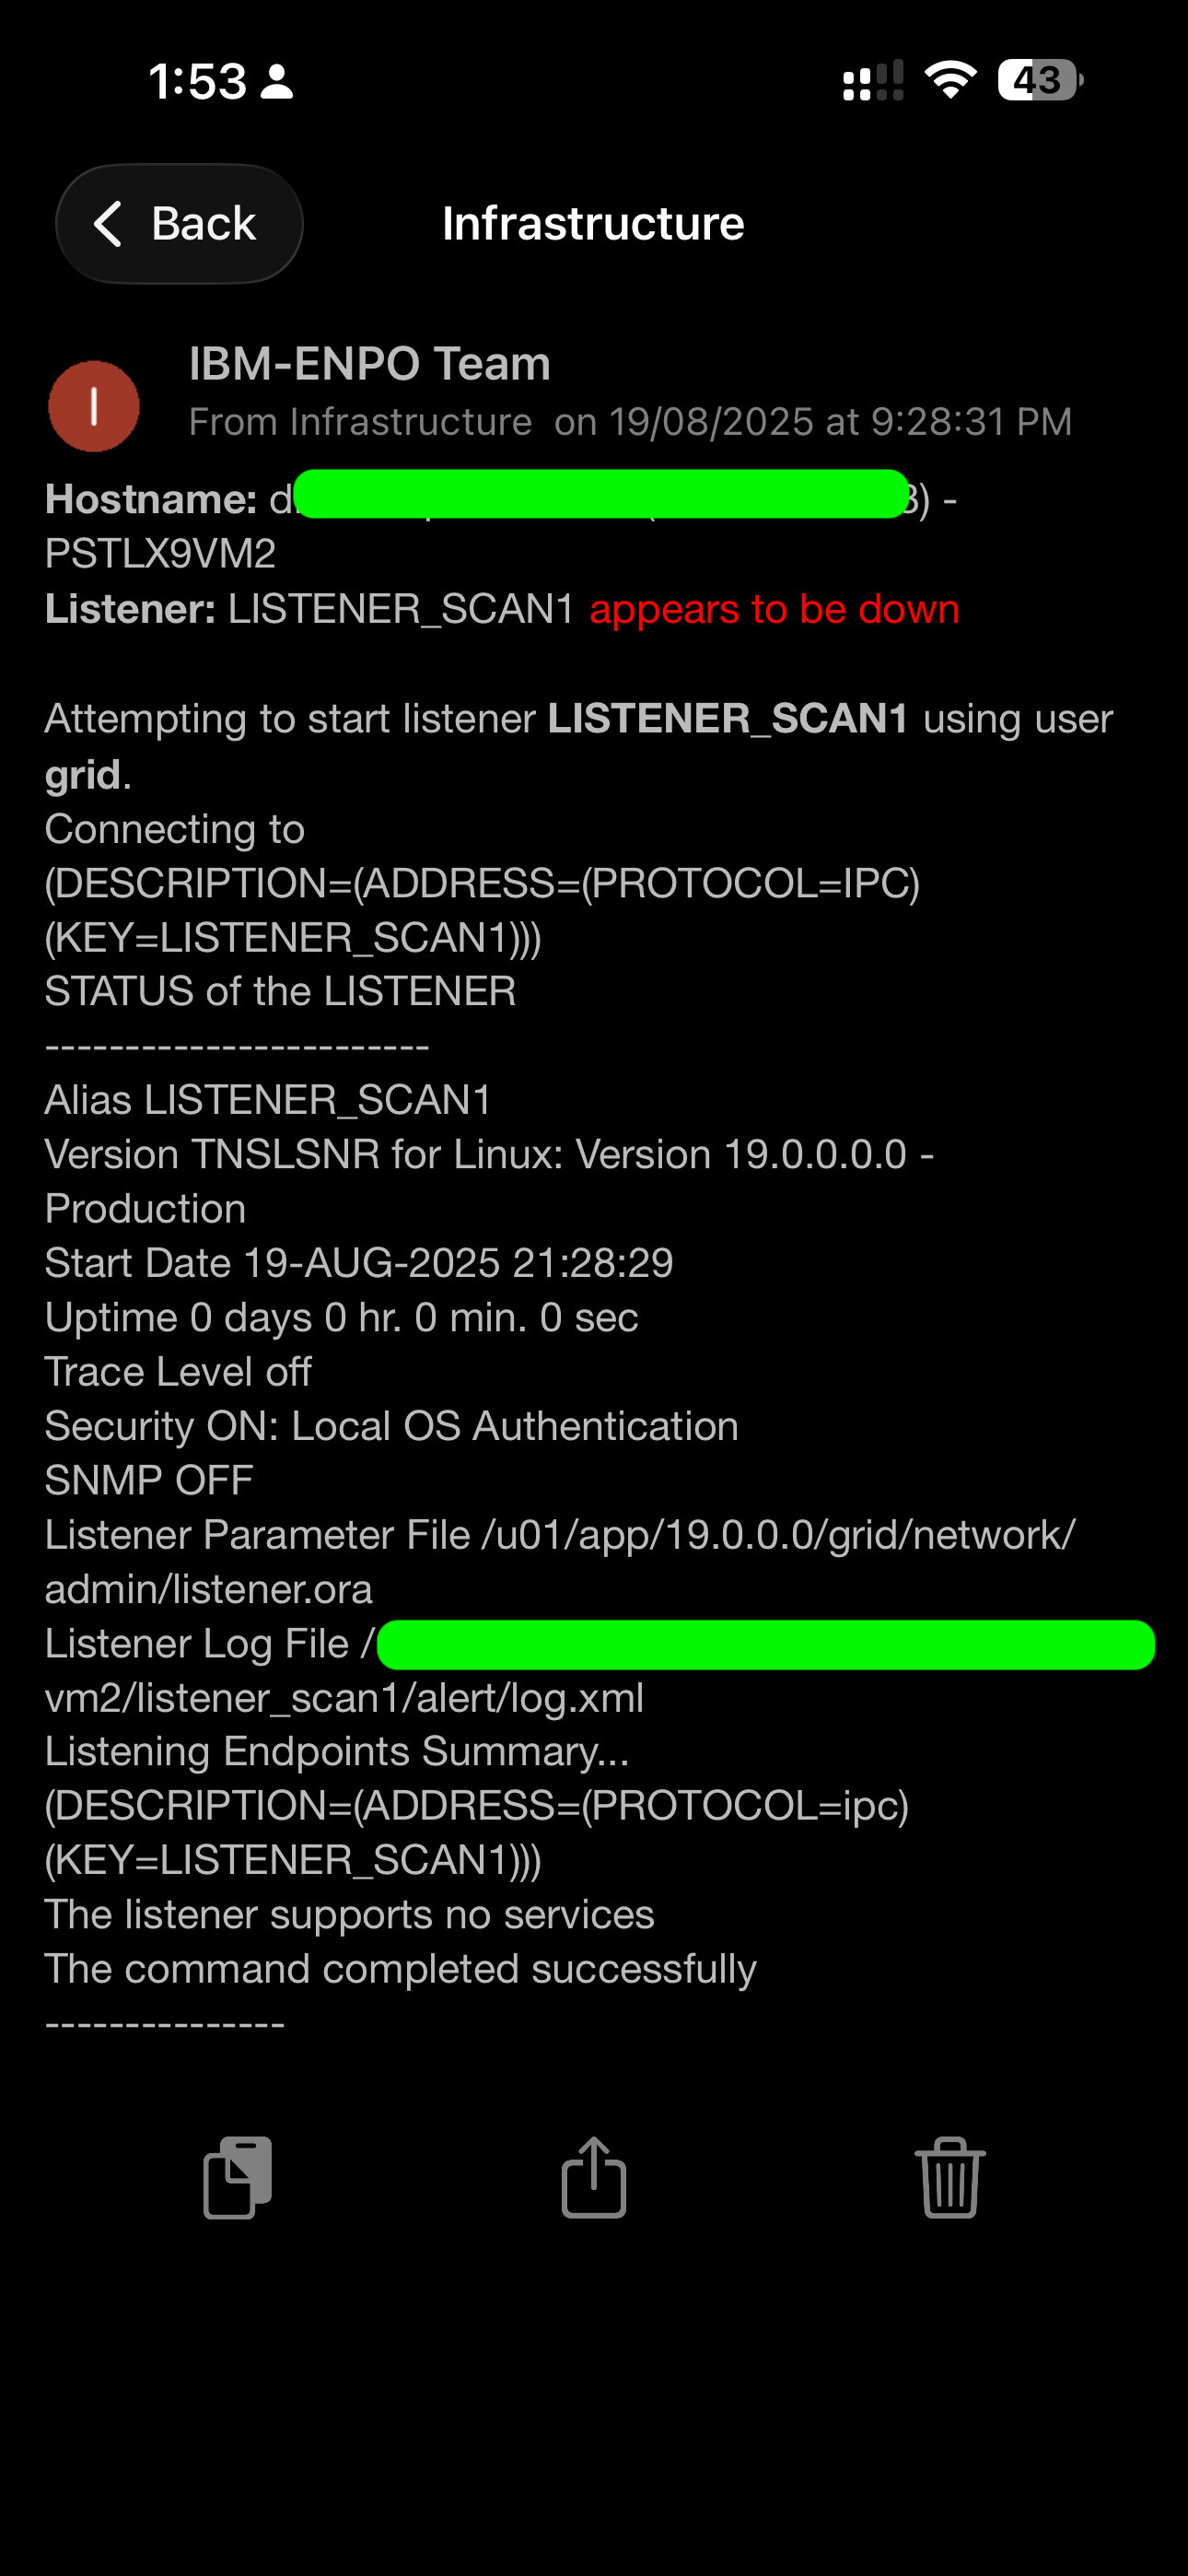
- SCAN listeners and node listeners
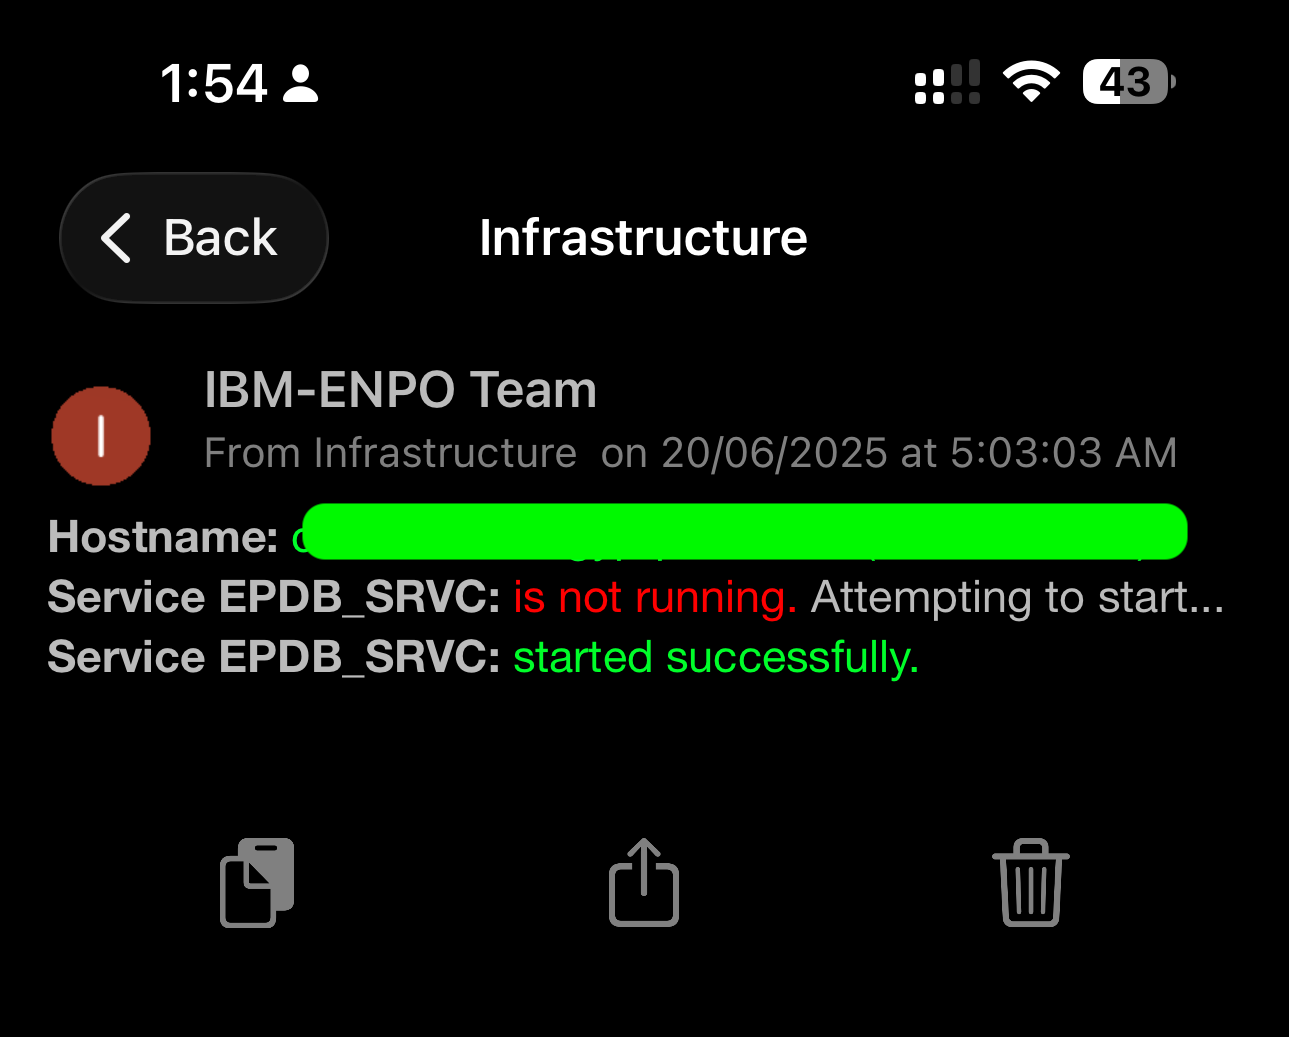
- Database service states
- ASM diskgroup status
- Tablespace usage
- Local OS authentication checks
- Alert log summaries
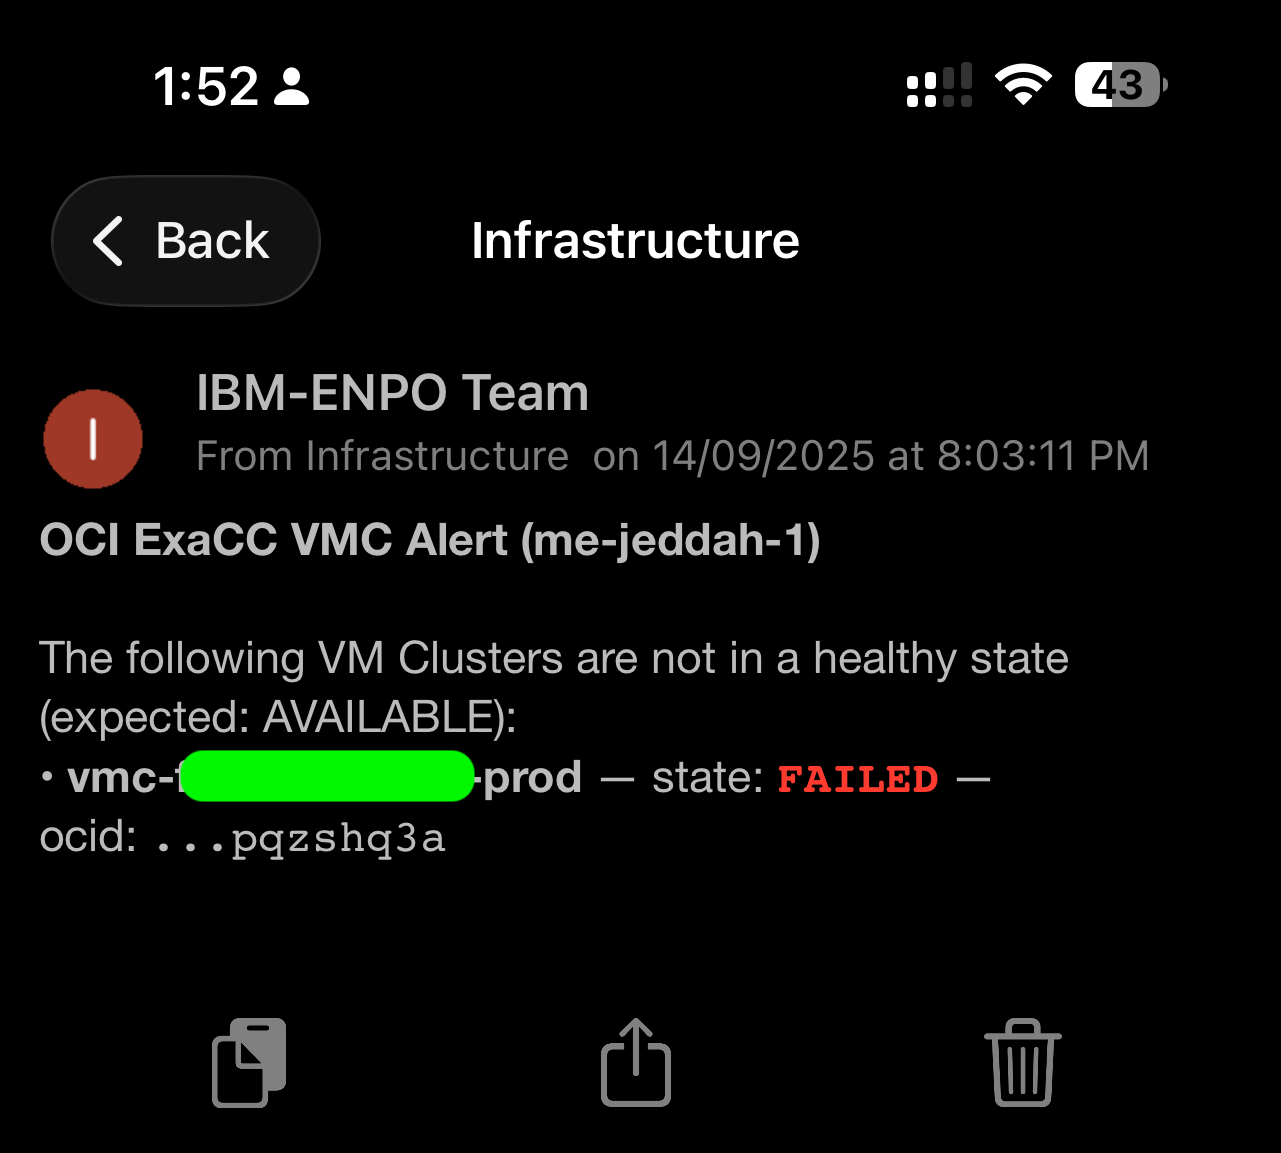
Exadata / ExaCC
- VM Cluster SCAN
- Cluster state (AVAILABLE, FAILED)
- OCID verification
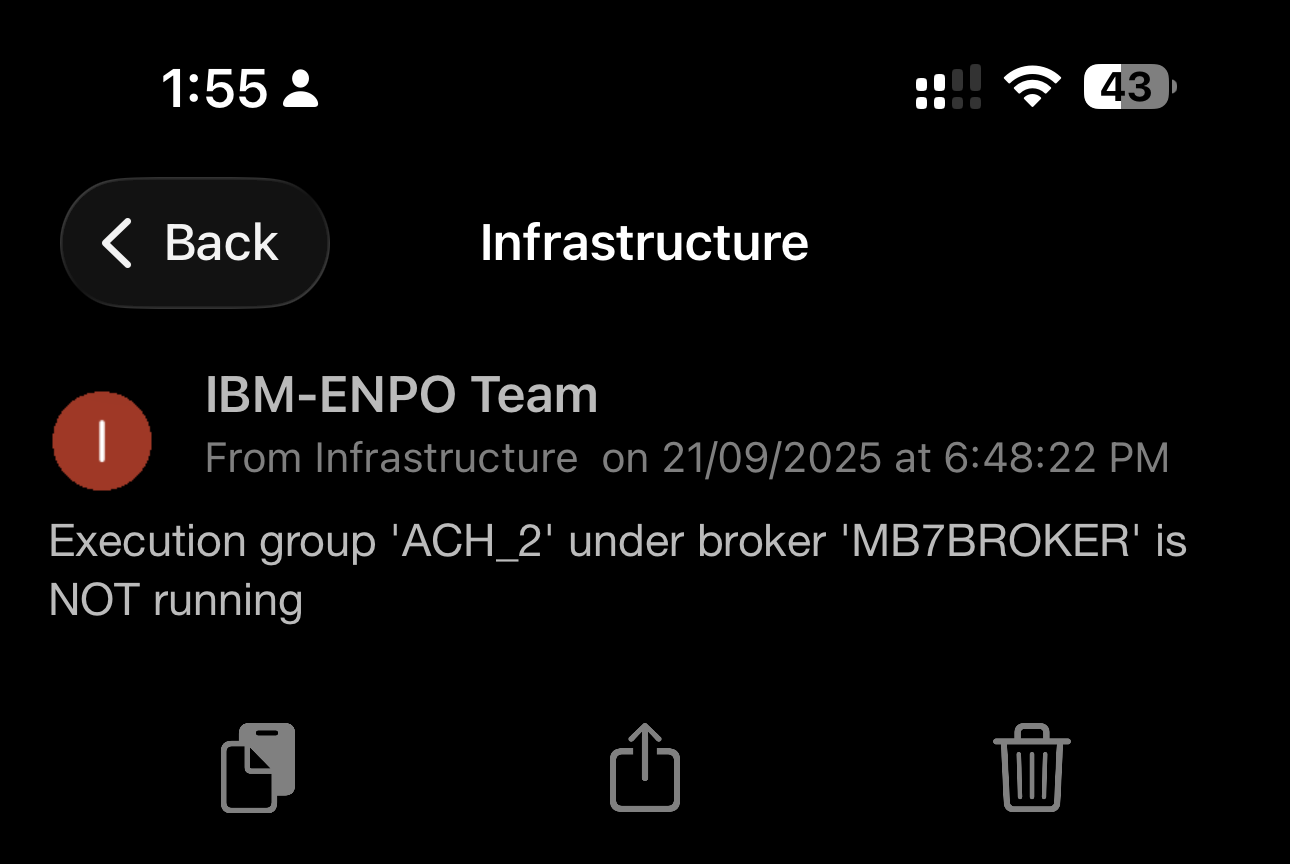
IBM ACE / Integration Bus
- Execution groups (e.g., ACH_2 not running)
- Broker health
- Automatic recovery
WebSphere & Java
- JVM health via JMX
- Thread pool utilization
- JDBC pool status
- Servlet response anomalies
Everything was scripted and automated. No manual execution needed.
3. Pushover as the Real-Time Notification Layer
I chose Pushover as the alert delivery mechanism for several reasons:
- Extremely reliable push delivery
- Fast (sub-second)
- Secure (HTTPS with per-user keys)
- Supports rich formatting
- Great for mobile alerting
Each alert included:
- Hostname
- Component name
- Status (with colored formatting)
- Timestamp (EET)
- Extracted log details (e.g., listener logs, usage stats)
- Automated recovery actions where applicable
The screenshots — disk alerts, listener restarts, VM cluster failures, execution group issues — all originated from this system.
4. Secure “Transient Internet Window” Architecture
To preserve internal security:
- The managing node had no permanent internet access
- Before sending a Pushover alert, the script opened a single outbound rule via API
- It sent the alert
- It immediately closed the connection
The window typically stayed open for less than 1 second
This design ensured:
- Zero inbound exposure
- Zero long-lived routes
- Zero persistent public connectivity
- Full auditability
This was one of the most important architectural decisions — and it worked flawlessly.
5. Automated Healing for Selected Services
Instead of just notifying when something was broken, the system often tried to fix it first.
Examples:
- If LISTENER_SCAN1 was down, it automatically attempted a restart using the grid user — results attached in the screenshot you shared
- If ACE execution groups were stopped, it attempted to bring them up
Only after taking action did it send the final alert showing:
“is not running. Attempting to start…” followed by: “started successfully.”
This system transformed the operational reliability of ENPO’s infrastructure.
Before
- Outages discovered by end users
- Slow recovery, long war rooms
- Fragmented logs and manual checks
- No visibility of Oracle listener or Exadata VM cluster issues until too late
After
- Instant push notifications on any anomaly
- Automated recovery for common issues
- Unified visibility across Oracle, Exadata, WebSphere, ACE, AIX, Linux
- Zero security tradeoffs — everything contained inside the network
- Hands-free, 24/7 monitoring on mobile devices
It gave the team the confidence to respond before incidents escalated — every time.
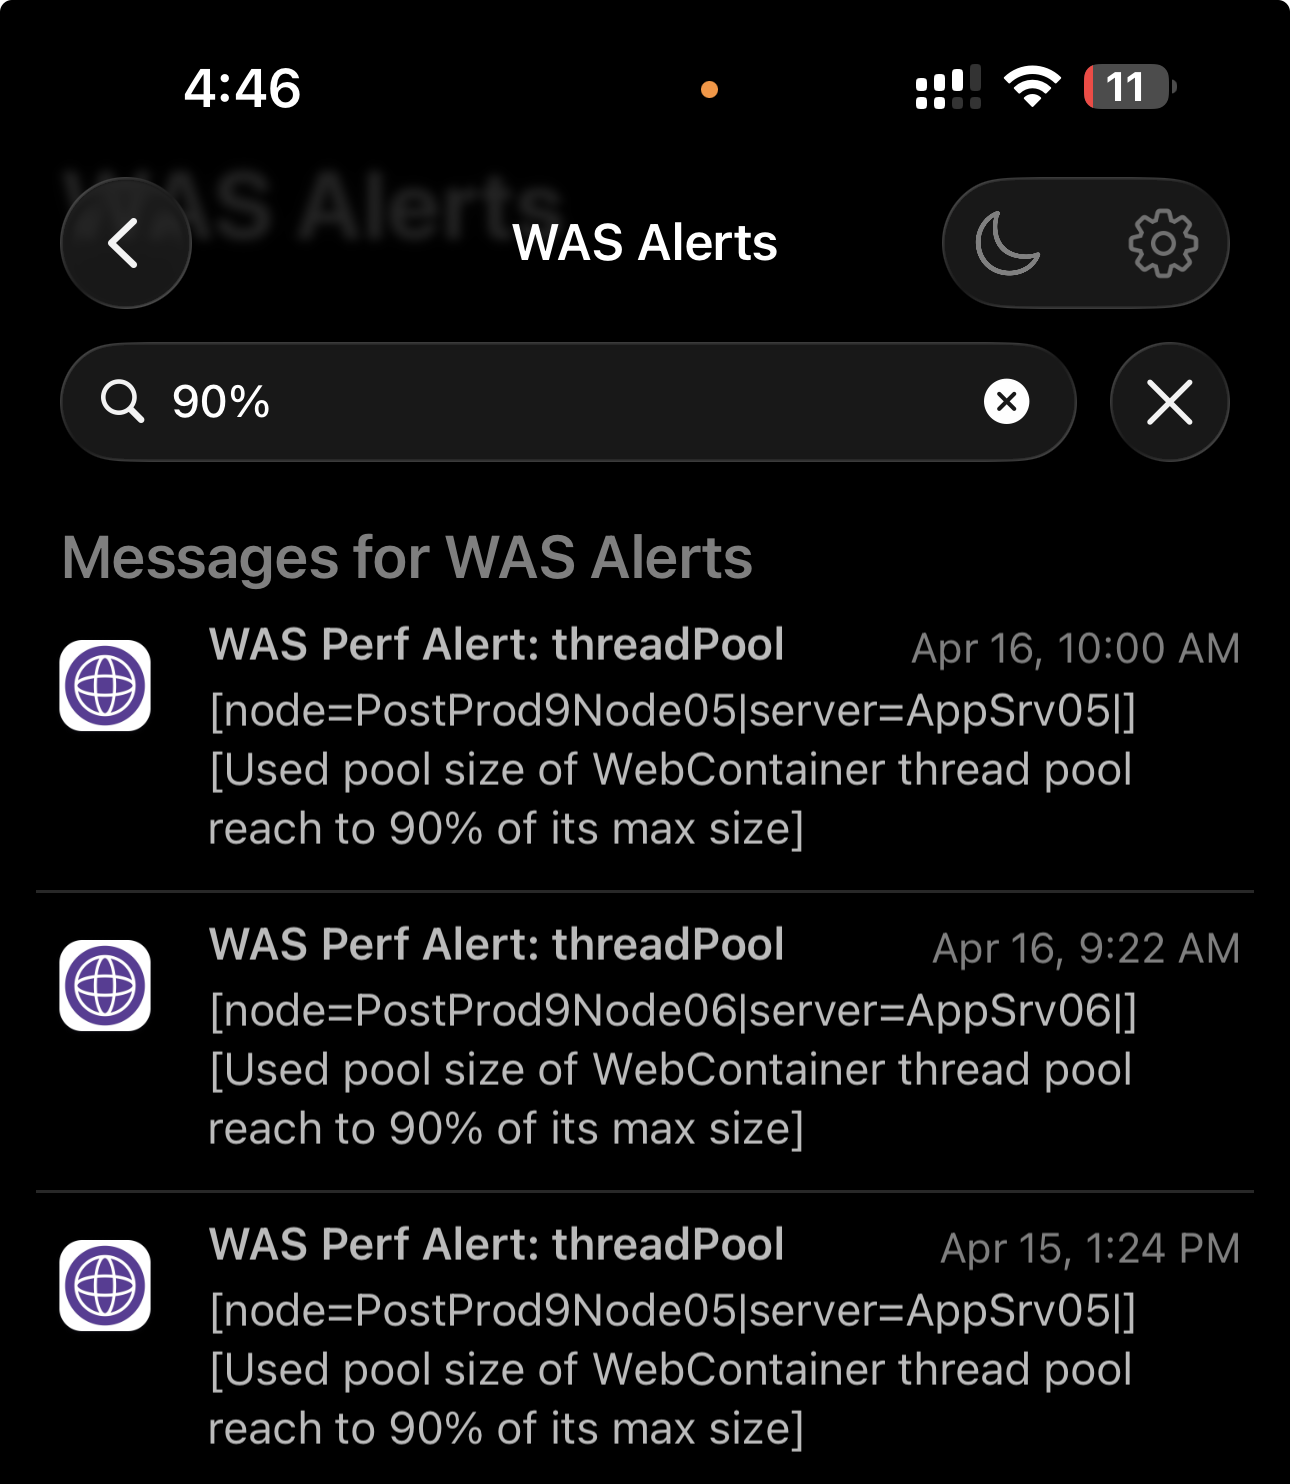
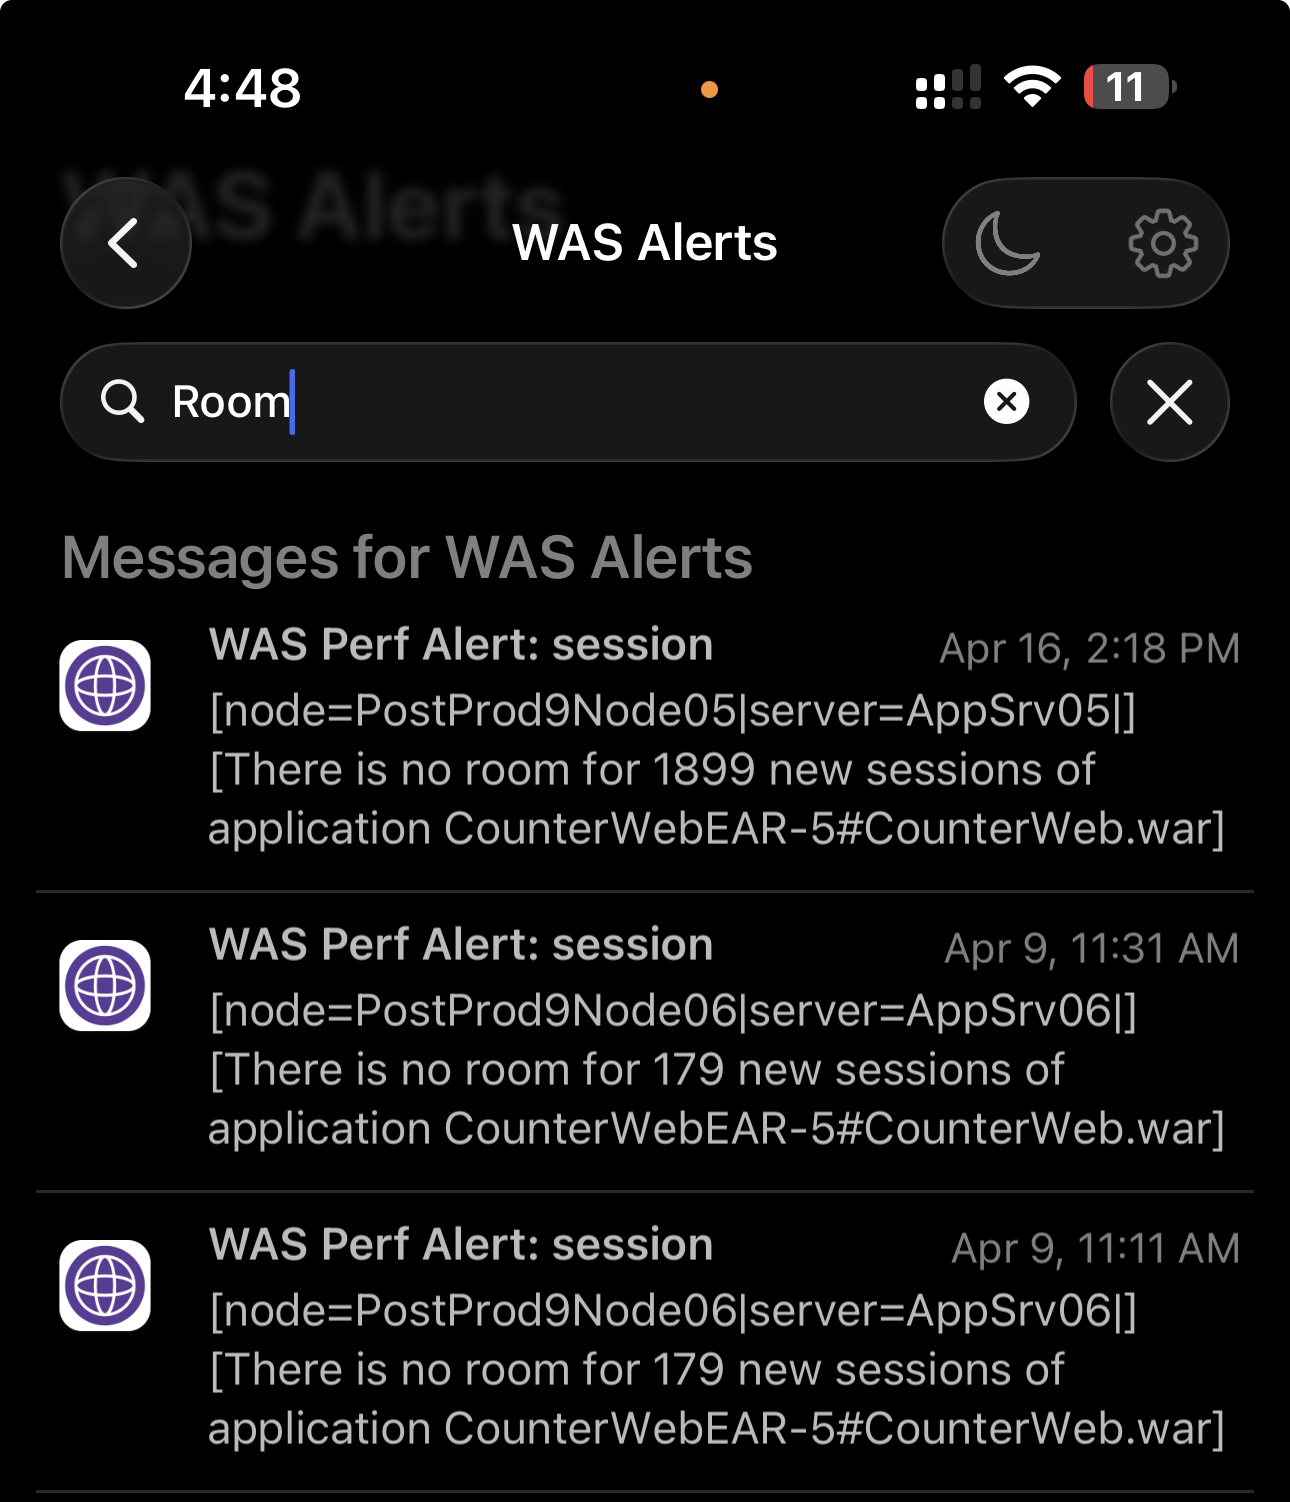
IBM WAS Performance Toolkit with Proactive Alerting (Pushover Integration)
Although IBM WebSphere Performance Monitoring Toolkit is old yet it is a powerful tool for analyzing JVM and application performance metrics.
The only issue after using it for a while is that its usage model is inherently reactive, requiring the user to be actively connected and observing the UI in order to detect issues.
This creates a visibility gap in real-world operations, where:
- Performance degradation may occur outside monitoring windows
- Critical symptoms (e.g., thread pool exhaustion, session pressure) can be missed
- There is no built-in mechanism for proactive alerting or external notifications
To address this limitation, I implemented a proactive notification mechanism by extending the internal behavior of the toolkit.
This involved:
- Analyzing and modifying internal classes within the toolkit (reverse engineering approach)
- Injecting logic to trigger alerts based on runtime conditions
- Integrating Pushover as an external notification channel
A configurable file (pushover.properties) was introduced to allow flexible setup, including:
- Pushover API token and user key
- Proxy configuration (for restricted enterprise environments)
- Notification timing and retry behavior
- Alert clearing and lifecycle handling
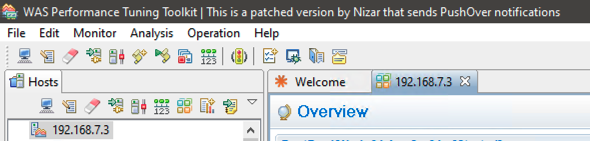
The result is a patched version of the toolkit that can push real-time alerts externally, without requiring continuous UI monitoring.
The modified version is easily identifiable via the updated application title, as shown in the screenshot.
This enhancement transforms the toolkit from a passive monitoring tool into a proactive alerting system, enabling:
- Immediate visibility of critical performance issues
- Reduced dependency on manual monitoring
- Faster response times to production incidents
- Improved operational awareness